What do we learn from the 2019 User Survey?
Thank you all for participating in the Library user survey 2019!
The survey held from 4 to 17 November 2019 is a very helpful tool for the libraries to understand how patrons evaluate our wide range of resources, services and facilities in terms of importance and performance. Apart from identifying performance gaps, we have made use of this valuable opportunity to explore user behaviours and needs. All the findings will serve as good references or guidance to our future planning and developments.
We are pleased to receive a record-breaking response of 6,533 completed questionnaires this time, some 48% increase from the last survey. 76.7% of the respondents selected the Main Library as the library they used most. Despite some slight differences in the rating among our major user groups, the results summarized below reflect the increasing expectation of our patrons in both traditional and modern library functions. Both the ratings and freeform comments have suggested many challenges imposed by the divergent use of our library resources and learning spaces. Our future strategic plan and ongoing new services for G/F and Ingenium 2/F of Main Library will take into consideration the key findings of this survey and include an effort to meet the needs of the patrons.
Performance rating by user groups (All)*
| HKU UG | HKU PG | HKU Acad | HKU Non-Acad | SPACE student | SPACE staff | CC student | CC Staff | Alumni | CoF | Other | Overall | |
|---|---|---|---|---|---|---|---|---|---|---|---|---|
| Highest | 5.86 | 6.34 | 6.48 | 6 | 6.04 | 6.1 | 6.18 | 6.02 | 6.11 | 5.95 | 6.06 | 6.16 |
| Lowest | 4.94 | 5.3 | 5.17 | 4.94 | 5.08 | 5.03 | 5.08 | 5.1 | 4.87 | 4.78 | 4.95 | 5.08 |
Performance rating by user groups (HKU only)*
| Arch | Arts | B&E | Den | Edu | Engg | Law | Med | Sc | Soc Sc | Other | Overall | |
|---|---|---|---|---|---|---|---|---|---|---|---|---|
| Highest | 6.11 | 6.38 | 6.38 | 6.30 | 6.39 | 6.30 | 6.61 | 6.35 | 6.31 | 6.34 | 6.18 | 6.16 |
| Lowest | 4.84 | 5.03 | 4.79 | 4.99 | 5.20 | 4.92 | 4.90 | 5.19 | 4.94 | 4.80 | 4.90 | 5.08 |
* On a scale of 1 to 7
A majority of the respondents (approximately 74%) indicated that they frequently undertake quiet study in the Libraries. About 61% expressed that they frequently have a general study or research using internet sources in the Libraries. With the new introduction of uPrint services in Libraries last August, 53% of the survey participants answered that they used the uPrint services in Libraries. These findings echo the increasing importance of libraries’ roles in various aspects of the resources, services and spaces among users. It also reinforces our belief that more emphasis is needed for the learning resources and environment to support our community’s learning and research.
Biggest Gaps/Smallest Gaps
Through 30 survey statements, we measured users’ perception of the importance for major library resources, services and facilities as well as our performance in each area on a scale of 1 to 7 (7 being most important or best possible performance). By comparing the overall mean importance and performance of each area, the gap between these two scores was calculated. The bigger the gap, the more improvement is needed to meet users’ expectations.
Among the five areas with the biggest gap scores, nearly all have shown a narrower gap as compared to 2017, meaning that there is an improvement in their performance. In particular, after the stock-taking exercises by libraries, item 4 shows a significant narrower gap from 0.78 to 0.57!
| 2019 | 2017 | |
|---|---|---|
| 1 | I can find a quiet place in the Library to study when I need to (0.69)* |
The items I’m looking for on the Library shelves are usually there (0.78) |
| 2 | I can find a place in the Library to work in a group when I need to (0.63) |
A computer is available when I need one (0.74) |
| 3 | Online resources (e.g. e-journals, databases, e-books) meet my learning and research needs (0.59)* | Online resources (e.g. e-journals, databases, e-books) meet my learning and research needs (0.73)* |
| 4 | The items I’m looking for on the Library shelves are usually there (0.57) |
I can find a quiet place in the library to study when I need to (0.69)* |
| 5 | Find@HKUL is easy to use (0.56)* | When I am away from campus I can access the library resources and services I need (0.69)* |
* Areas also rated top 10 in importance
On the other hand, the smallest gaps are found in the following five areas where we perform the best. The statistics demonstrated that the Libraries were striving for excellence in the past two years.
| 2019 | 2017 | |
|---|---|---|
| 1 | Library workshops, classes and tutorials help me with my learning and research needs (-0.03) | Library workshops, classes and tutorials help me with my learning and research needs (0.06) |
| 2 | Face to face enquiry services meet my needs (0.00) | Library staff treat me fairly and without discrimination (0.11) |
| 3 | Library staff treat me fairly and without discrimination (0.00) * | Self Service (e.g. self check loans, requests, renewals, holds) meet my needs (0.15) |
| 4 | Electronic enquiry services (e.g. email, WhatsApp-a-Librarian) meet my needs (0.05) | Face to face enquiry services meet my needs (0.17) |
| 5 | Self Service (e.g. self check loans, requests, renewals, holds) meets my needs (0.08) | Electronic enquiry services (e.g. email, WhatsApp-a-Librarian) meet my needs (0.22) |
* Areas also rated top 10 in importance
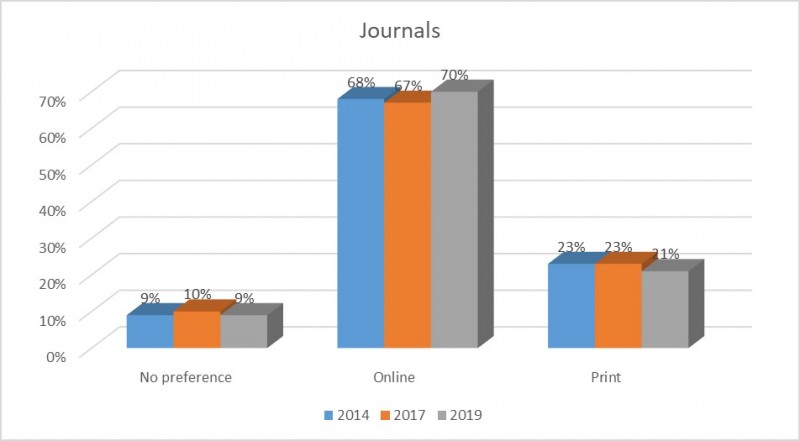
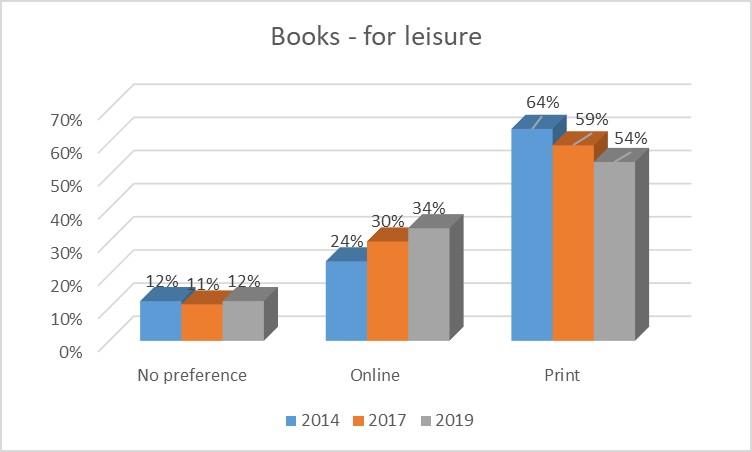
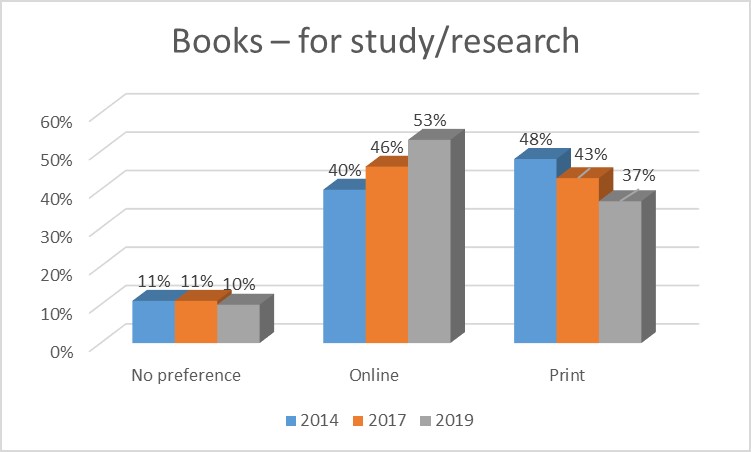
User Preferences for Print vs Electronic
Comparing with the results of the 2014 and 2017 user surveys, there is a continuous shift of preferences from print books to e-books while the preferred format for the journal has remained quite steady.
Journals
Response to the Survey’s Freeform Comments
Respondents also provided us about 1,995 comments on areas we are doing well or need changes and improvement. The most common areas identified from each library are analyzed and addressed by responsible librarians as follows:
User Survey Data Report
Click here for the data report of the 2019 user survey