What we learn from the 2017 User Survey?
It has been three years since the Libraries conducted its last survey. The recent survey held from 13 to 27 March 2017 is therefore a very useful lens for us to understand how patrons rate our wide range of resources, services and facilities in terms of importance and performance. Apart from identifying performance gaps, we have made use of this valuable opportunity to explore user behaviours and needs. All the findings will serve as good reference or guidance to our future developments.
We are pleased to receive an overwhelming response of 4,421 completed questionnaires this year, some 250% increase from the last survey. 74.2% of the respondents selected the Main Library as the library they used most. Despite some slight difference in the rating among our major user groups, the results summarized below reflect the increasing expectation of our patrons in both traditional and modern library functions. Both the ratings and freeform comments have suggested many challenges imposed by the divergent use of our library resources and learning spaces. Our 2017/18 strategic plan and coming renovation projects for G/F and 2/F of Main Library and the Yu Chun Keung Medical Library have taken into consideration the key findings of this survey and included a wide range of efforts to meet these challenges.
Performance rating by user groups (All)*

Performance rating by user groups (HKU only)*

* On a scale of 1 to 7
A new set of questions was introduced this year to look into our users’ online activities and their use of multimedia materials. A majority of the respondents (approximately 75%) indicated that they frequently undertake these activities in the Libraries or other places. This finding echoes the increasing importance accorded to our computing and network facilities in recent surveys. It also reinforces our belief that more technological and multimedia support is needed for our community’s learning and research.
Biggest Gaps/Smallest Gaps
Through 28 survey statements, we measured users’ perception of the importance for major library resources, services and facilities as well as our performance in each area on a scale of 1 to 7 (7 being most important or best possible performance). By comparing the overall mean importance and performance of each area, the gap between these two scores was calculated. The bigger the gap, the more improvement is needed to meet users’ expectation.
Among the five areas with the biggest gap scores, the top two have shown a narrower gap as compared to 2014, meaning that there is improvement in their performance.
|
|
2017 |
2014 |
|
1 |
The items I’m looking for on the Library shelves are usually there (0.78) |
The items I’m looking for on the Library shelves are usually there (1.16) |
|
2 |
A computer is available when I need one (0.74) |
A computer is available when I need one (0.89) |
|
3 |
Online resources (e.g. e-journals, databases, e-books) meet my learning and research needs (0.73)* |
Find@HKUL is easy to use (0.77) |
|
4 |
I can find a quiet place in the library to study when I need to (0.69)* |
The Library website is easy to use (0.75) |
|
5 |
When I am away from campus I can access the library resources and services I need (0.69)* |
Printing, scanning and photocopying facilities in the Library meet my needs (0.72) |
* Areas also rated top 10 in importance
On the other hand, the smallest gaps are found in the following five areas where we perform the best:
|
|
2017 |
2014 |
|
1 |
Library workshops, classes and tutorials help me with my learning and research needs (0.06) |
Library workshops, classes and tutorials help me with my learning and research needs (-0.04) |
|
2 |
Library staff treat me fairly and without discrimination (0.11) |
Library staff treat me fairly and without discrimination (0.07) |
|
3 |
Self Service (e.g. self check loans, requests, renewals, holds) meet my needs (0.15) |
Face to face enquiry services meet my needs (0.12) |
|
4 |
Face to face enquiry services meet my needs (0.17) |
Self Service (e.g. self check loans, requests, renewals, holds) meet my needs (0.14) |
|
5 |
Electronic enquiry services (e.g. email, WhatsApp-a-Librarian) meet my needs (0.22) |
Electronic enquiry services (e.g. email, WhatsApp-a-Librarian) meet my needs (0.15) |
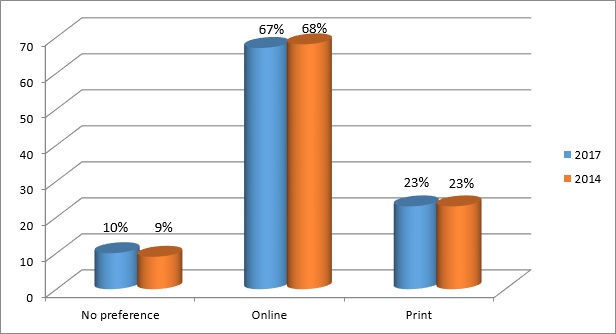
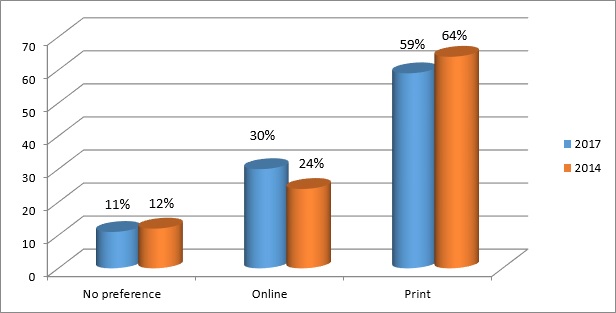
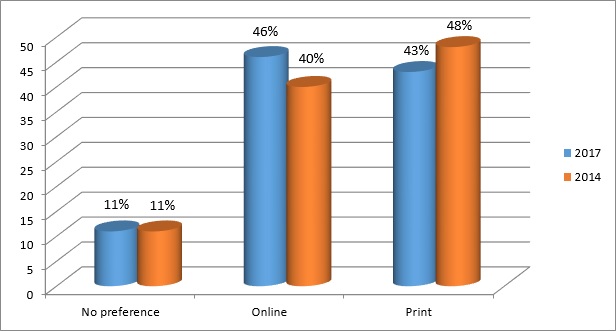
User Preferences for Print vs Electronic
Comparing with the results of the 2014 user survey, there is a continuous shift of preferences from print books to e-books while the preferred format for journal has remained quite steady.
Journals
Books – for leisure
Books – for study/research
Response to the Survey’s Freeform Comments
Respondents also provided us more than 1,400 comments on areas we are doing well or need changes / improvement. The most common areas identified from each library are analyzed and addressed by responsible librarians as follows:
User Survey Data Report
Click here for the data report of the 2017 user survey